Soil Water Mapping
Water drives agricultural production in northern NSW and knowledge of stored soil moisture is essential to crop planning and decision making. To fully realise the potential of variable rate agriculture, measurement of variation in soil moisture is required. The possibilities for measuring soil water spatially include the use of Electromagnetic Induction (EMI).
How does it work?
Electromagnetic induction measures the apparent electrical conductivity (ECa) of the soil profile. The instrument contains a transmitter and a receiver induction coil at opposite ends of the instrument. There are many physical and chemical soil attributes that are known to influence ECa including: percent of clay and texture, salinity, moisture content, CEC, mineralogy, porosity, organic matter, soil depth and temperature. However, clay, moisture and salinity have the largest influence.
If clay content and salinity content remain constant, changes in EMI readings over time will reflect changes in soil moisture content.
In this project a paddock was surveyed using EMI and the resulting map used to split the paddock into three moisture zones (low, medium and high). Soil coring revealed that these three zones represented differing soil depth. Soil characterisation sites were established on each of the three zones to obtain water holding capacity. This involves wetting up the soil to find out the water content when it is full (upper limit), growing a crop in the soil and measuring the water content when the crop has drawn as much water as possible from the soil (lower limit). From this two measurements soil water capacity can be obtained. EMI readings are taken on the sites when the soil is fully wet and fully dry. This enables calibration of approximate soil moisture to EMI reading.
An EMI survey was taken towards the end of the fallow when there was confidence the profile was full or near full, this gives a map of a “wet” paddock. A similar map made after a dry harvest gives a map of the paddock “dry”. These maps represent the either end of the spectrum in terms of soil water for cropping.
Pros/cons
Using this method there is the potential to map soil water during fallow and also during the crop. This would allow the use of variable rate application of inputs according to soil type and moisture. On Figure 2 below it can be seen that starting moisture by soil sampling at the start of the 2020 crop generally matches up with the zone obtained by EMI (low, medium, high). There are however some instances where it does not and may be a result of the EMI survey not being intense enough ie the runs were too far apart (36 metres). Closer runs would incur additional cost.
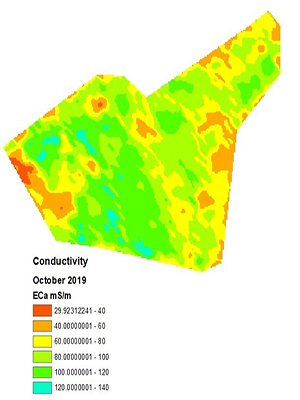
Figure 1: EMI survey of a fallow paddock showing variations in conductivity.
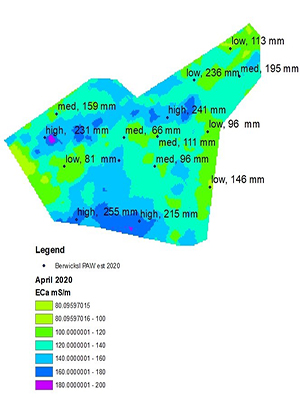
Figure 2: EMI survey of the same paddock six months later with increased conductivity and soil moisture. Points show starting moisture from soil sampling at the same time as the EMI survey.