Frosted crops: What are your options?
By Callen Thompson, Mixed Farming Officer and Rohan Leach, Regional Agricultural Landcare Facilitator
September 2020
Good rainfall across the majority of the Central West has the region looking magnificent. However a combination of early sown crops and exceptionally cold out of season weather have meant that some farmers are facing high losses to potential grain yield due to frost. Farmers should be assessing crops for frost damage to determine the best option available to them.
Identifying Frost
Cereals are most susceptible to frosts between ear emergence and grain-fill while canola and legumes are susceptible whilst they are flowering. After a frost event farmers should aim to inspect their crops 7-10 days later for easy identification. Look in the most susceptible parts of the landscape such as the lower parts of the landscape or paddocks nearby rivers and creeks. If the crop is damaged here proceed to higher ground and reassess, stopping every 10-20 paces across the paddock to assess frosting.
Stem frost can occur in cereals if the head has not emerged from the boot. To check that the developing head has not been damaged, you will need to carefully dissect the plant from the top down to find the head of the plant inside the leaf sheaths. If the crop has flowered, open the florets to check if the grain is developing. If you are worried you cannot identify accurately it is a good idea to tag a few plants with tape and return a week later to determine if head/grain development and grain filling is continuing.
There are videos on how to identify frost damage on the GRDC website: https://grdc.com.au/resources-and-publications/resources/frost-management/tips-for-identifying-frost-damage
To calculate the best option financially, we need to estimate grain yield, dry matter yield and know the cost of production and commodity prices. When assessing yields, it is important to go to an area that is representative of the paddock. If there are areas of the paddock that are significantly higher or lower yielding and it is possible to treat them differently, it may be wise to measure them separately. As with all measurements we do in our cropping systems, the more samples you take, the more accurate your results will be with at least ten samples advised.
Calculating grain yield
As mentioned, find a representative area of the paddock. Measure out a metre of row, then count the number of heads and work out average grains per head. Don’t count heads that are significantly smaller and will not make grain. Within the meter row count the number of grains on ten representative heads. You can count on one side of the head, then double that number.
Then the formula is the number of grains per head, multiplied by the number of heads, multiplied by a factor of 0.027 to 0.029. That’s to take account of grain size per thousand grains, and divided by the row spacing in centimetres. So, if it’s a 25cm row spacing you’d obviously divide by 25.
NSW DPI has a great YouTube tutorial that walks you through the process: www.youtube.com/watch?v=T2lDiX6_7NM
Calculating dry matter
Find an area of the paddock that representative of the whole paddock. Using the Local Land Services Pasture Square, cut herbage inside of the square to ground level and place in a paper bag.
Weigh each sample individually and record weights. Calculate the average wet weight. Mix samples together then take out a sub-sample. Dry the sub-samples in a microwave. Place sample in the microwave with a separate container with 100ml of water in it. This will reduce the chance of fire.
Cook on high for five minutes, take the sample out and weigh it. Put the sample back into the microwave and cook for a further three minutes, then weigh again. Continue until the final weight equals the previous weight. Do not burn the sample!
The final weight is the dry sub-sample weight (all moisture removed). Use the formula below to calculate kg/DM/ha:
(Dry sub-sample weight (g) / wet sub-sample weight (g)) x average wet weight (g) = dry sample weight
Dry sample weight (g) x 110 = Dry matter per hectare (kg/DM/ha)
(Note: “110” is a factor specific to the LLS Pasture Square).
To calculate the amount of hay you can harvest off the paddock, you take the dry matter per hectare value, then add 10% to account for moisture. You then take away 20% for harvest loss. If you have to cut the paddock higher than normal, you can do the initial herbage cut at mowing height. Keep in mind that you will still need to do the grazing calculations from a herbage cut at ground level.
Calculating stocking rate
Some producers will have stock on hand, while others will be looking at buying in trading stock or providing agistment. For ease of providing an example, I am using agistment stock but you can still do the same comparison for other options if you know how many stock you can graze and the number of days grazing. The following calculations will give you the stocking rate per hectare.
Dry matter per hectare (kg/DM/ha) - Desired residual = Available pasture
Available pasture - wastage (30%) = Net supply (kg/DM/ha)
Net supply/(intake per head (3% of body weight) x grazing days required)= stocking rate per hectare
Financial return
To calculate the financial return of each option, we need to know our cost of operations and the commodity price of each product. Filling in the following table will allow you to calculate which the best option in terms of financial return is. You may need to include other costs depending on your system, especially for the grazing option.
Financial return of Hay/grain/graze | |||||
Grain | Hay | Grazing - Agistment | |||
Costs | |||||
Harvest $/ha | Mowing/conditioning $/ha | Livestock management $/ha | |||
Storage $/ha | baling $/ha | ||||
Transport $/ha | Stacking $/ha | ||||
Total Costs/ha | Total Costs/ha | Total costs/ha | |||
Income | |||||
Grain yield t/ha | Hay yield t/ha | Stocking rate beast/ha | |||
Price $/t | Price $/t | Number of days of grazing | |||
Agistment price per head per day $ | |||||
Income/ha (yield x price) | Income/ha (yield x price) | Income/ha (stocking rate x number of days x $/head) | |||
Financial return $/ha (total cost - income) | Financial return $/ha (total cost - income) | Financial return $/ha (total cost - income) | |||
Nutrient removal
Nutrient removal differs from grain to hay. The below table is data collected by Incitec Pivot from paddocks on the Riverine Plains, Victoria. It is possible to use this data combined with the grain and dry matter yields above to calculate nutrient removal per hectare. Once you know the removal per hectare it is possible to calculate the rate of fertiliser needed to replace removal. The cost of replacement is dependent on the fertiliser you use to replace the particular nutrient. In fertile soils, you may not get an economic response replacing nutrients that are in high abundance.
N (kg/t) | P (kg/t) | K (kg/t) | S (kg/t) | Zn (g/t) | Cu (g/t) | |
Canola grain | 32.9 - 35.3 | 4.3 - 5.4 | 6.5 - 7.7 | 4 - 4.1 | 43.5 - 44.8 | 2.7 - 3 |
Canola hay/silage at 50% flower | 31 | 3.4 | 26 | 5.5 | 24 | 3.4 |
Wheat grain | 15.5 - 20.8 | 2.1 - 2.28 | 3.1 - 3.4 | 1.33 - 1.53 | 18 - 31 | 2.6 - 3.1 |
Wheat hay/silage at early flower | 18 - 23 | 1.8 - 2.1 | 20 - 27 | 1.9 - 2 | 17 - 21 | 3.9 - 5 |
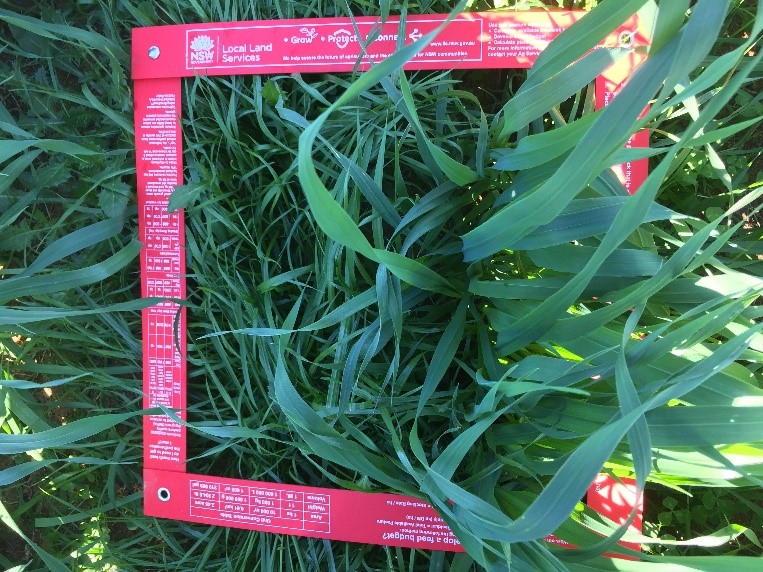
The LLS Pasture square is a great tool for measuring a metre of row or to work out dry matter per hectare
Like all aspects of farming, you need to weigh up what works best for your business. There is economic, nutrition and future crop factors that will influence your decisions. If you would like further information or help making grain, hay or graze decisions, please contact your Local Land Services Ag Advisor.