Fertilising your pastures – Can you afford not to?
11 Feb 2022
Ross Kuchel, Senior Ag Advisor, South East Local Land Services
The current spike in fertiliser prices has certainly created a degree of concern in agricultural production systems. The price of single superphosphate (SSP), the most widely used of all fertilisers in our region, has in some cases more than doubled year on year. That said, on the other end of the ledger stock prices have moved in a very similar upwards trend. So, the question is, is there still value in applying fertiliser?
Cost vs Income
Figure 1 below shows the movement in Superphosphate and Australian beef prices for the past 15 years. The phosphate price is based on the global market for triple superphosphate (TSP). The beef price is Australian export processed beef (see details below). The 15-year time span has been used to include the last fertiliser price spike back in 2008. Included also is the three year restocker yearling steer indicator.
The variance between the export and domestic (RS steer) beef pricing is primarily due to the impact of drought and the subsequent demand for restocking post drought.
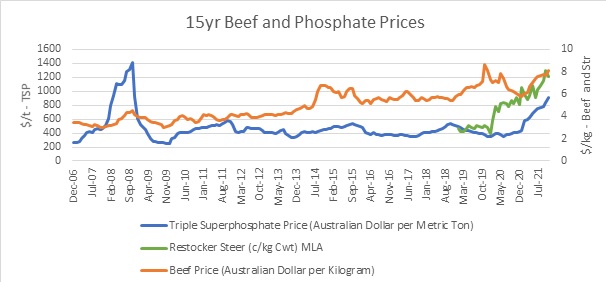
Figure 1. 15 year Beef and Phosphate Price movement.
Source – www.indexmundi.com, MLA
*TSP (triple superphosphate), bulk, spot, beginning October 2006, Tunisian origin, granular, fob; previously US origin, f.o.b. US Gulf
*Meat, beef (Australia/New Zealand), chucks and cow forequarters, frozen boneless, 85% chemical lean, c.i.f. U.S. port (East Coast), ex-dock, beginning November 2002; previously cow forequarters
*Restocker Yearling Steer, NSW – MLA
If we look at the ratio between Beef and TSP prices as shown in Figure 2, the trendline indicates we have been through a nine-year period of declining fertiliser prices relative to the value of beef (i.e. more bang for your buck!). We have only now just moved into the territory where fertiliser price increases have exceeded the increasing beef value. The graph highlights just how significant the 2008 fertiliser price spike was.
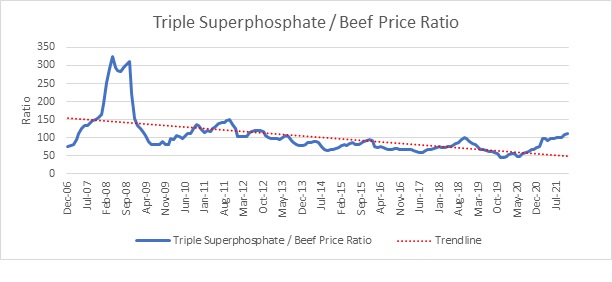
Figure 2. Ratio of price movement of Triple Superphosphate to Beef from 2006 to 2021.
Marginal Thinking
Tables 1 and 2 show a breakdown of the gross margins for a typical self-replacing merino flock and a feeder steer breeding operation for 2020 and 2022.
The year-on-year increases for both enterprises in gross income and variable costs relate to the rise in returns for livestock and fibre, and the associated increases in selling and replacement costs. Exclusive of fertiliser (SSP) costs, the stronger market conditions for 2022 resulted in an increase in returns of $4.69/dse ($47/ha) in the sheep enterprise and $25/DSE ($250/ha) in the cattle operation.
At face value, the fertiliser price spike we are currently experiencing is a major deterrent to its use this year. However, as shown in table 1, even with a 250% increase in the price of SSP, the additional cost per DSE is only $4.65. As such, the year-on-year gross margin remains constant at $48.30/DSE.
In table 2, the massive rise in fertiliser prices has corresponded with an equivalent rise in the cattle market. In the 2020 gross margin, fertiliser represents 7% of the gross margin of $51.83/DSE. In 2022, this only increases by 3% to represent 10% of the overall gross margin of $72.65/DSE.
Table 1. Sheep enterprise gross margins - fertiliser price variable
20um Self-Replacing merino flock with 25% of ewes joined to a terminal sire | ||
|---|---|---|
2020 | 2022 | |
Gross Income/DSE | $73.00 | $80.00 |
Variable Costs/DSE (ex sup feed and fert) | $20.91 | $23.22 |
SSP $/t | $330.00 | $850.00 |
SSP $/ha spread | $38.00 | $84.50 |
SSP $/DSE | $3.80 | $8.45 |
Gross Margin/DSE | $48.29 | $48.33 |
Table 2. Cattle Enterprise Gross Margins - Fertiliser Price Variable
Feeder Steer Breeding operation – Steers sold at 18mths | ||
|---|---|---|
2020 | 2022 | |
Gross Income/DSE | $63.55 | $95.00 |
Variable Costs/DSE (ex sup feed and fert) | $7.92 | $13.90 |
SSP $/t | $330.00 | $850.00 |
SSP $/ha spread | $38.00 | $84.50 |
SSP $/DSE | $3.80 | $8.45 |
Gross Margin/DSE | $51.83 | $72.65 |
Sheep Source: NSW DPI/Graham AdvisoryStocking Rate - 10dse/ha, 9kg SSP/dse applied, 2021 Av. sheep and wool prices used for 2022 GM, 2020 (Apr-Sep) Av sheep and wool prices used for 2020 GM
Cattle Source: NSW DPI/MLA Stocking Rate – 10DSE/ha, 9kg SSP/DSE applied, January 2022 prices used for 2022 GM, March 2020 prices used for 2019 GM
What if I don’t fertilise?
If by not fertilising carrying capacity drops by 2 DSE/ha, this equates to a reduced gross margin of $96/ha in the sheep enterprise and $145 for the cattle operation. As such, there is respectively a 14% and 20% return on investment in ensuring soil fertility is maintained.
The example above looks to apply a level of phosphorous (P) with which to maintain a constant stocking rate of 10dse/ha. If a paddock’s P levels are at the upper end of the response curve (see fig 3), and especially on soils with a high PBI (Phosphorous Buffering Index), then the impact on pasture growth from missing a year’s P application may be minimal. However, the lower P levels are from being optimal (ie. further down the curve), the greater the impact will be from not replacing the previous year’s usage.
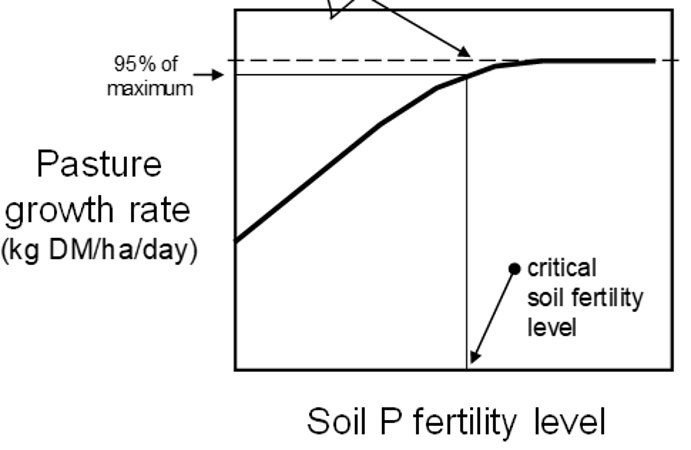
Figure 3. Pasture response curve relative to soil phosphorous levels
Source: Five easy steps to ensure you are making money from superphosphate
This analysis is based on stocking rates being at or near long term optimal levels relative to soil fertility. If based on current soil test results, your stocking rates are below optimal (eg. if still rebuilding from the drought), then it may be prudent not to fertilise. There is no point in spending money to grow more grass if you’re not going to use it.
In conclusion
Worldwide supply constraints have resulted in a spike in agricultural fertilisers prices, especially for Nitrogen and Phosphorous. However, unlike in 2008 livestock prices have also been on an upwards trajectory. As a result, the marginal rates of return from investing in maintaining soil fertility levels have remained near constant.
Hence the question needs to be asked – can I afford NOT to apply fertiliser this year!
Note: Fertiliser in this article relates primarily to the supply of phosphorous, as this is the predominant limiting nutrient in our high rainfall zone, permanent pasture based grazing systems typical of SE NSW.
References
- www.indexmundi.com (Triple superphosphate and beef price comparison).
- www.mla.com.au – NSW Yearling Steer Indicator.
- NSW DPI/Graham Advisory - Farm Enterprise Budget Series – 2020 and 2022 Merino ewe gross margin.
- Five Easy Steps manual –developed by CSIRO and NSW DPI with financial assistance from Pastures Australia.